
 Facebook
 X
X
 Pinterest
 Copy Link

Proud to be proud of a winning team! Cheers to more success Century 21 Coastal Realty team!
Market Information •
January 26, 2022
Bank of Canada Interest Rate Announcement – January 26, 2022
While the majority of expert opinion had swung toward the Bank of Canada raising its overnight rate this morning, the Bank instead maintained its overnight rate at 0.25 per cent. However, in the statement accompanying the decision the Bank noted that slack in the economy has been absorbed and it is ending what it calls its “exceptional forward guidance” on the policy interest rate. This is a clear signal that the Bank will begin raising its overnight policy rate, likely at its next meeting in March. The Bank also noted that the Canadian economy grew much faster than expected over the second half of 2021 and has entered 2022 with considerable momentum. While the Omicron variant is weighing on activity in the first quarter, its impact is expected to be modest. Importantly, the Bank expects inflation to remain close to 5 per cent (annualized) over the first half of 2022 before declining to 3 per cent by the end of the year.
Inflation continues to run ahead of the Bank of Canada’s 2 per cent target and inflation expectation are noticeably rising. That has prompted the Bank to bring its rate tightening forward by several months. We expect the Bank will begin tightening in March, ultimately bringing its overnight rate to 1.75 per cent by early 2023. Canadian fixed-rate mortgages have already been rising in anticipation of a higher Bank of Canada rate and are now closing in on their pre-pandemic level of 3 per cent.
Source: British Columbia Real Estate Association
Market Information •
January 18, 2022
Housing Market Update – January 2022

Watch BCREA Chief Economist Brendon Ogmundson discuss the December 2021 statistics.
Community Spotlight •
January 14, 2022
Fleetwood, Surrey

Today we’re featuring another beautiful community in Surrey. Please watch this video for more information about Fleetwood.
Market Information •
January 12, 2022
5 Highest Assessed Homes in the Lower Mainland in 2022
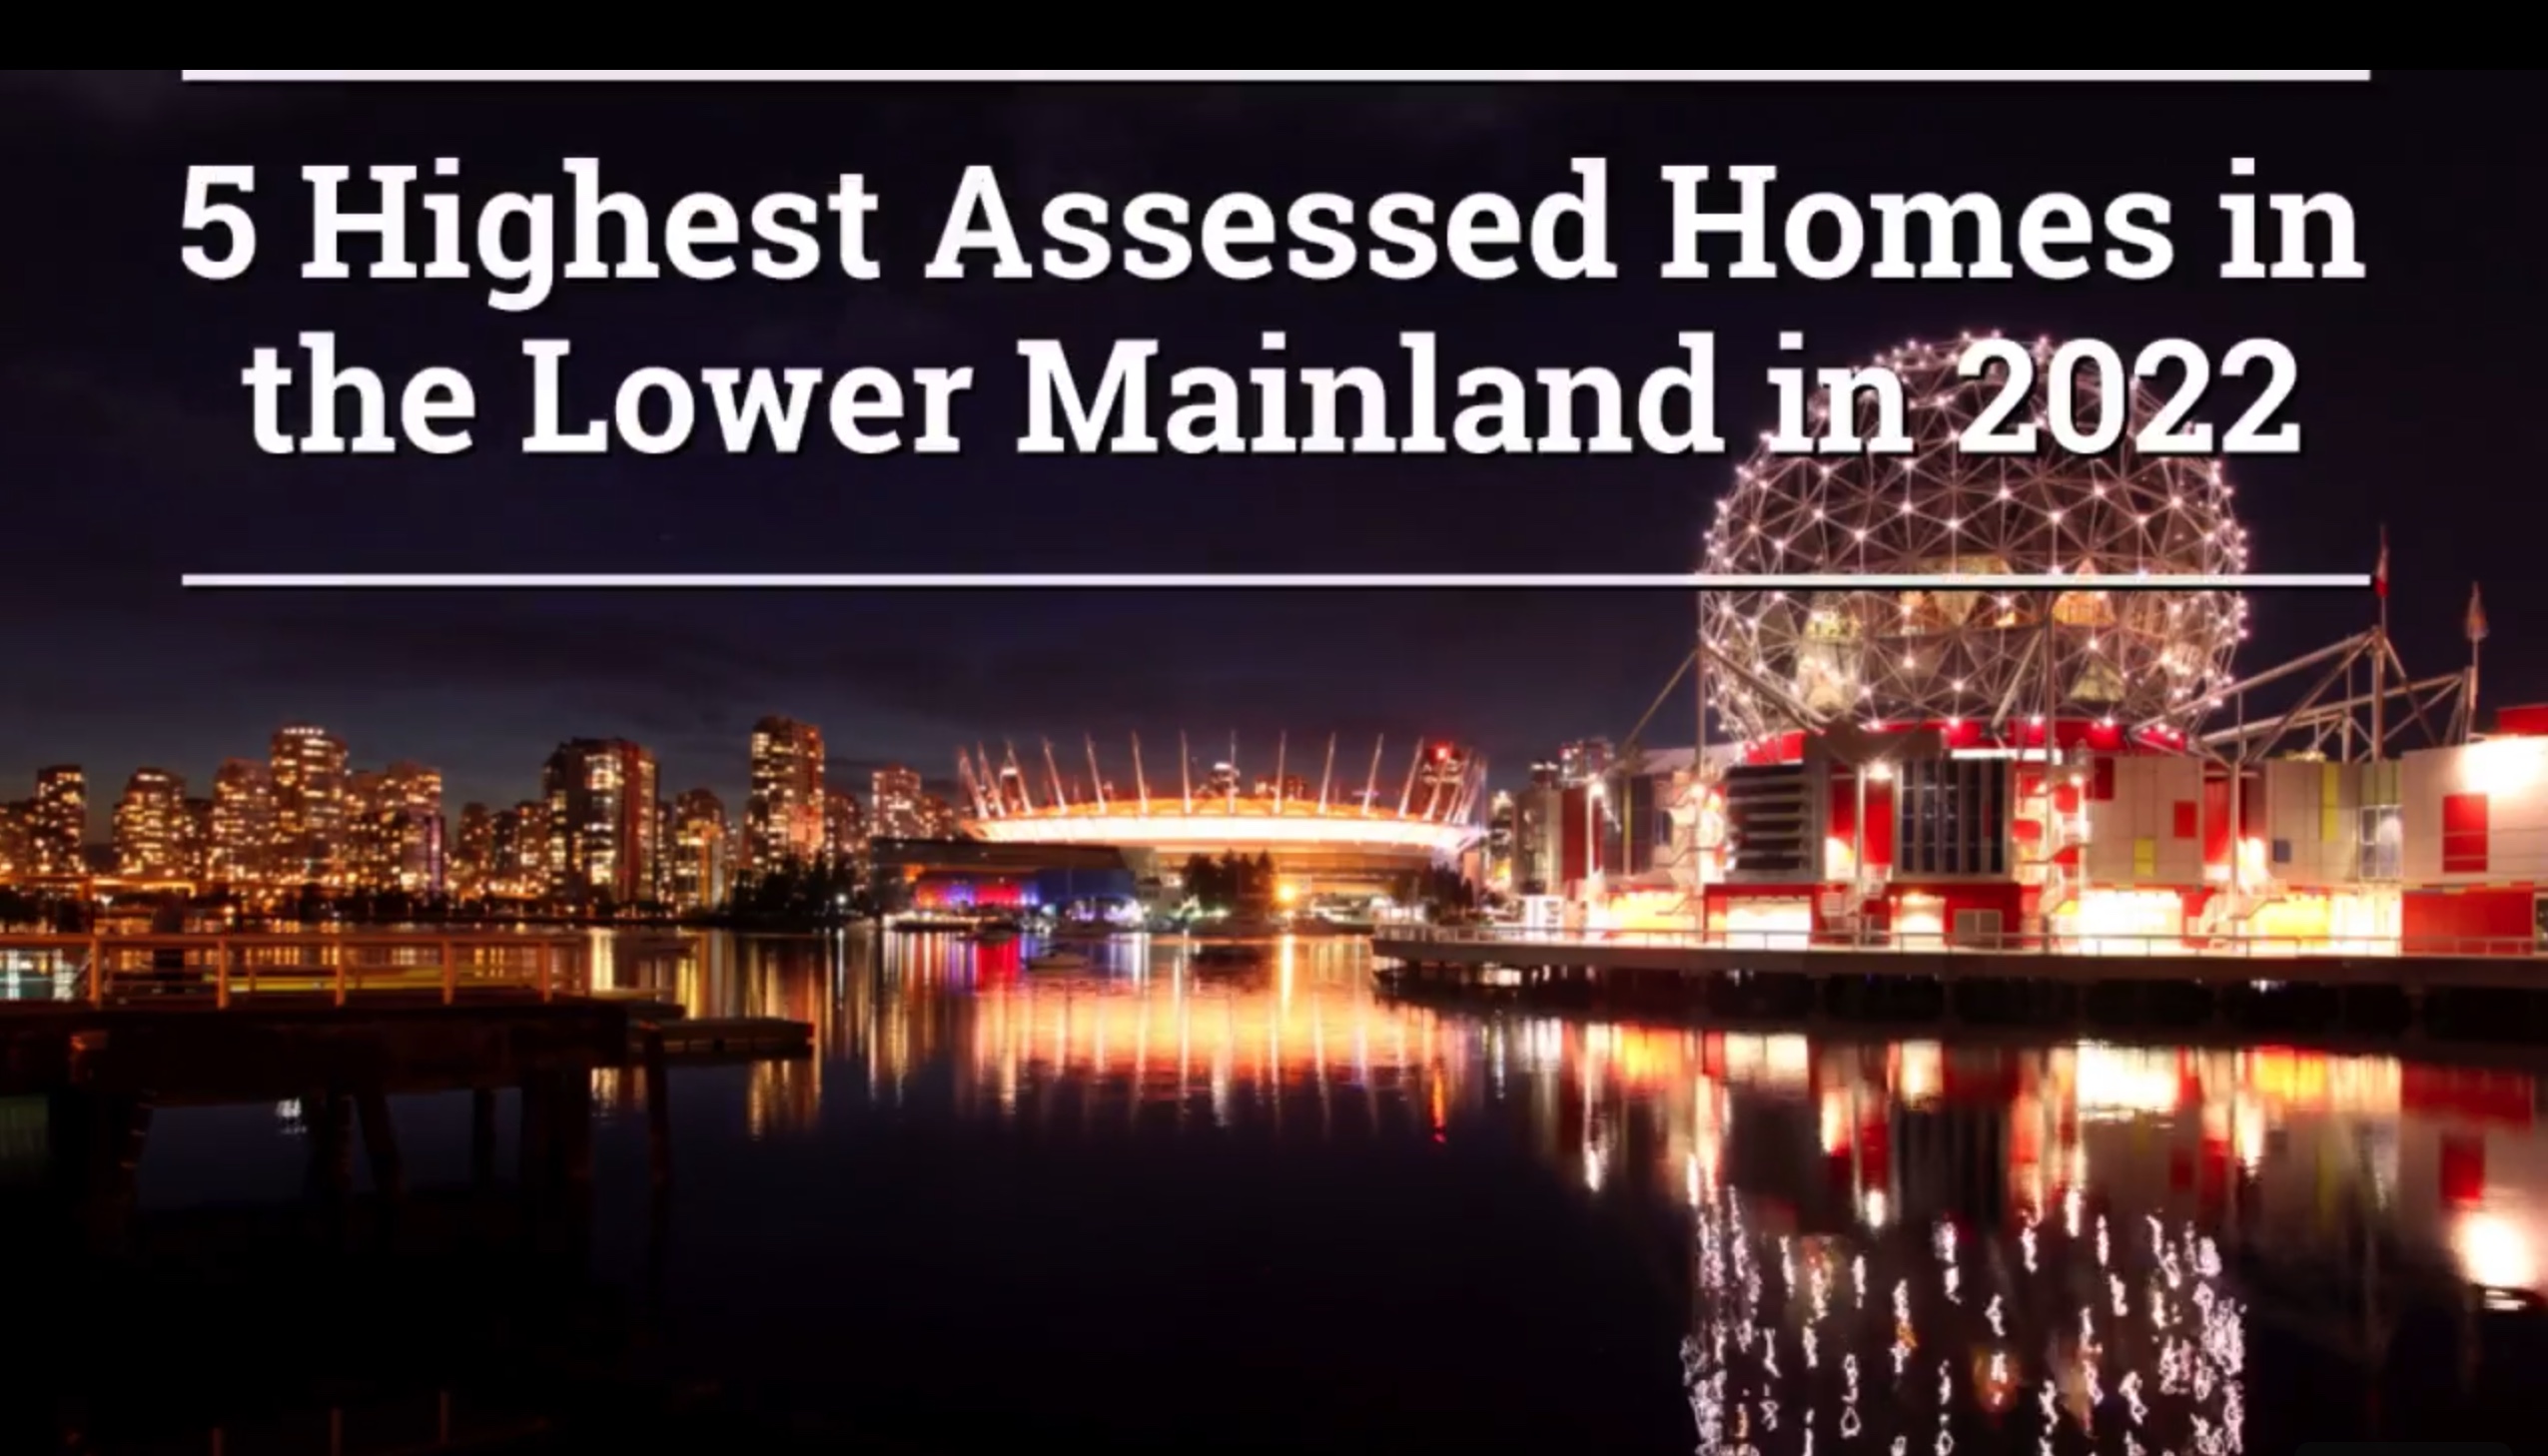
Here are the top 5 most expensive homes in the Lower Mainland according to BC Assessment released for the year 2022. If you add the taxable value of Vancouver’s top 10, the value of those single-family homes would be equal to the GDP of Tonga, a country with over 100,000 people living in it.
Market Information •
January 10, 2022
Lower Mainland 2022 Property Assessments: Market Trends
As B.C.’s trusted provider of property assessment information, BC Assessment collects, monitors and analyzes property data throughout the year.
For the Lower Mainland region, the overall total assessments have increased from about $1.46 trillion in 2021 to about $1.75 trillion this year. Over $23.7 billion of the region’s updated assessments is from new construction, subdivisions and the rezoning of properties. BC Assessment’s Lower Mainland region includes all of Greater Vancouver, the Fraser Valley as well as the Sea to Sky area and the Sunshine Coast.
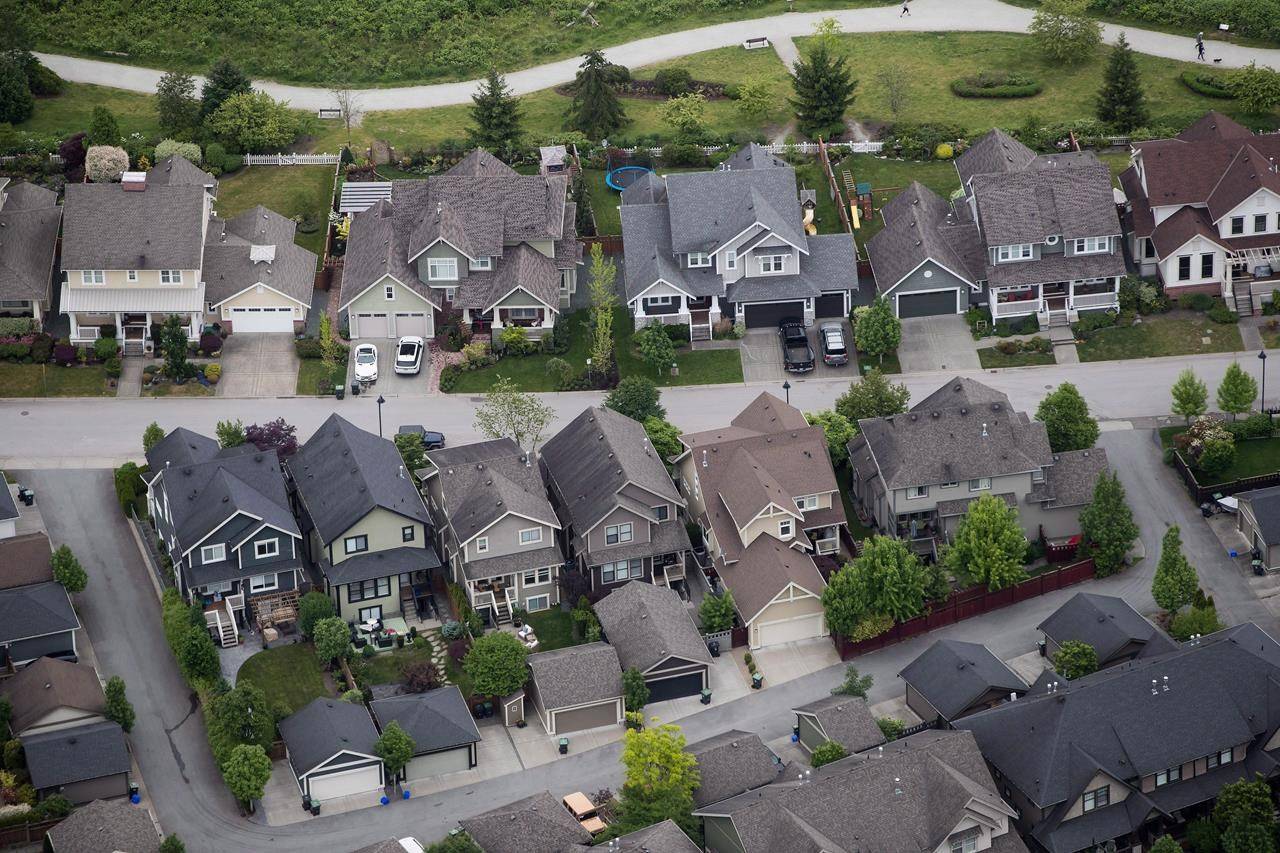
The summaries below provide estimates of typical 2021 versus 2022 assessed value changes of residential properties for each community throughout the region.
These examples demonstrate market trends for single-family residential properties by geographic area:*
|
Single Family Home Changes by Community |
2021 Typical Assessed Value
as of July 1, 2020 |
2022 Typical Assessed Value
as of July 1, 2021
|
% Change |
| City of Vancouver | $1,717,000 | $1,997,000 | +16% |
| University Endowment Lands | $4,923,000 | $5,461,000 | +11% |
| City of Burnaby | $1,449,000 | $1,725,000 | +19% |
| City of Coquitlam | $1,187,000 | $1,499,000 | +26% |
| City of Port Coquitlam | $944,000 | $1,233,000 | +31% |
| City of Port Moody | $1,265,000 | $1,627,000 | +29% |
| City of New Westminster | $1,119,000 | $1,388,000 | +24% |
| City of North Vancouver | $1,452,000 | $1,777,000 | +22% |
| District of North Vancouver | $1,578,000 | $1,932,000 | +22% |
| District of West Vancouver | $2,473,000 | $2,992,000 | +21% |
| District of Squamish | $1,026,000 | $1,386,000 | +35% |
| Resort Municipality of Whistler | $2,033,000 | $2,629,000 | +29% |
| Village of Pemberton | $945,000 | $1,151,000 | +22% |
| Bowen Island Municipality | $1,019,000 | $1,271,000 | +25% |
| Village of Lions Bay | $1,436,000 | $1,934,000 | +35% |
| Village of Belcarra | $1,319,000 | $1,746,000 | +32% |
| Village of Anmore | $2,013,000 | $2,372,000 | +18% |
| Town of Gibsons | $671,000 | $895,000 | +33% |
| District of Sechelt | $600,000 | $819,000 | +37% |
| City of Surrey | $1,063,000 | $1,420,000 | +34% |
| City of White Rock | $1,242,000 | $1,582,000 | +27% |
| City of Richmond | $1,405,000 | $1,699,000 | +21% |
| City of Delta | $968,000 | $1,285,000 | +33% |
| Township of Langley | $986,000 | $ 1,319,000 | +34% |
| City of Langley | $838,000 | $1,162,000 | +39% |
| City of Abbotsford | $778,000 | $1,077,000 | +38% |
| City of Chilliwack | $627,000 | $877,000 | +40% |
| City of Maple Ridge | $814,000 | $1,118,000 | +37% |
| City of Pitt Meadows | $843,000 | $1,126,000 | +34% |
| City of Mission | $706,000 | $962,000 | +36% |
| District of Kent | $526,000 | $710,000 | +35% |
| District of Hope | $428,000 | $620,000 | +45% |
| Harrison Hot Springs | $599,000 | $807,000 | +35% |
*All data calculated based on median values.
These examples demonstrate market trends for strata residential properties (e.g. condos/townhouses) by geographic area for select urban areas:*
|
Strata Home Changes (Condos/Townhouses)By Community |
2021 Typical Assessed Value
as of July 1, 2020 |
2022 Typical Assessed Value
as of July 1, 2021
|
% Change |
| City of Vancouver | $711,000 | $759,000 | +7% |
| City of Burnaby | $588,000 | $646,000 | +10% |
| City of Coquitlam | $562,000 | $631,000 | +12% |
| City of Port Coquitlam | $506,000 | $576,000 | +14% |
| City of Port Moody | $622,000 | $732,000 | +18% |
| City of New Westminster | $512,000 | $558,000 | +9% |
| City of North Vancouver | $690,000 | $762,000 | +10% |
| District of North Vancouver | $727,000 | $834,000 | +15% |
| District of West Vancouver | $1,156,000 | $1,327,000 | +15% |
| District of Squamish | $560,000 | $724,000 | +29% |
| Resort Municipality of Whistler | $931,000 | $1,154,000 | +24% |
| City of Surrey | $510,000 | $604,000 | +18% |
| City of White Rock | $452,000 | $528,000 | +17% |
| City of Richmond | $608,000 | $677,000 | +11% |
| City of Delta | $552,000 | $625,000 | +13% |
| Township of Langley | $543,000 | $676,000 | +24% |
| City of Langley | $382,000 | $459,000 | +20% |
| City of Abbotsford | $342,000 | $412,000 | +21% |
| City of Maple Ridge | $456,000 | $563,000 | +23% |
*All data calculated based on median values.
BC Assessment’s website at bcassessment.ca includes more details about 2022 assessments, property information and trends such as lists of 2022’s top valued residential properties across the province.

Home Care Tips •
January 8, 2022
What should be included on your weekly cleaning checklist for the new year?

This cleaning checklist will help you get on to a good start in the new year, check it out!
Community Spotlight •
January 8, 2022
Newton, Surrey

Watch this video to know more about one of the most beautiful communities in Surrey.
Market Information •
January 7, 2022
Fraser Valley real estate market sees busiest year in 100‐year history
News Release
Fraser Valley Real Estate Board
SURREY, BC – Fueled by the consumer response to the COVID‐19 pandemic along with historically low interest rates, total property sales in the Fraser Valley in 2021 shattered the previous annual record last set in 2016.
The FVREB processed 27,692 sales its Multiple Listing Service® (MLS®) in 2021, an increase of 39.0 per cent compared 19,926 sales in 2020; and 15.5 per cent higher than 2016’s 23,974 sales.
Larry Anderson, President of the Board, said, “No one could have predicted how the pandemic would impact the real estate market. Our region’s relative affordability, combined with a newfound ability to work from home and the value for housing dollar in the Fraser Valley attracted buyers in numbers like we’ve never seen.
“Whether helping sellers list or helping buyers complete a sale, our Board averaged over 5,200 transactions every month. And even though our volume of new listings was also high, it just couldn’t keep up with the demand.”
Year‐over‐year, sales of detached homes soared by 31.8 per cent in 2021 compared to 2020; townhome sales increased by 33.7 per cent and sales of apartments increased by 68.9 per cent. Anderson added, “With the rapid escalation of prices in 2021, many buyers made decisions based on economic factors, resulting in an explosion of condo sales in our region.”
In 2021, the FVREB received 35,629 new listings – the second highest on record (second only to 2008 at 35,651); and 12.4 per cent more than in 2020.
Baldev Gill, Chief Executive Officer of the Board, said, “Fraser Valley REALTORS® played an instrumental role in helping people navigate their real estate buying and selling needs, through uncharted territory. It’s the professionalism and expertise of our members who have done a remarkable job serving the interests and needs of buyers and sellers throughout a most challenging and unusual year.”
In the month of December, the Board’s MLS® processed 1,808 sales, second only to December 2020’s record‐setting 2,086 sales. New listings in December were 1,278. By month’s end, active inventory finished at 1,957 units, 60 per cent below the 10‐year average, and the lowest in 41 years.
MLS® HPI Benchmark Price Activity
> Single Family Detached: At $1,500,000, the Benchmark price for an FVREB single‐family detached home increased 3.6 per cent compared to November 2021 and increased 39.0 per cent compared to December
2020.
> Townhomes: At $765,800, the Benchmark price for an FVREB townhome increased 3.5 per cent
compared to November 2021 and increased 32.9 per cent compared to December 2020.
> Apartments: At $549,200, the Benchmark price for an FVREB apartment/condo increased 3.5 per cent
compared to November 2021 and increased 25.3 per cent compared to December 2020.
Source: Fraser Valley Real Estate Board, January 5th 2022

